There are more than 500 undiscovered infected people below 15 in Berlin. The age distribution of the positively tested vs the demographic distribution shows that the youngest age class has been poorly tested.
Berlin
The German capital has not been hit hard by the pandemic disease. As of toady only slightly more than 5000 people have been tested positively at the SARS-CoV-2 virus and only few dead have been registered.
Berlin: we will miss the streets without traffic, the birds in the morning that are louder than our wake-up alarms, the sound of the skateboarders in the street instead of the noise of the rolling luggage, the parks and the backyards full of children with their parents in home office, the bicycles as main mean of transportation, the empty underground, everyone jogging, and the clean air.
Phase 2 is going to start.
The city council has imposed curfew regulations about one month ago, which so far seem to have worked pretty well in flattening the curve, despite a relatively large margin of freedom of movement.
The imposed lockdown allows to walk in pairs and families in the open air. Gatherings of more than two people are not allowed. Therefore, schools, universities, theaters, cinemas, restaurants, sports facilities and all shops except groceries were all closed.
At the moment, a positive, optimistic mood spreads around in the city. The city council is talking of relaxing some of these measures and some of them are already slowly returning to normal.
Protests against some restrictions, especially against the prohibition to demonstrate are getting louder as the days pass.
Despite what many people believe in other countries, restrictions of individual freedom in Germany and especially in Berlin are extremely unpopular. While Italians dare to show in television unprecedented and non commensurate police interventions in empty beaches or streets, the example in Berlin shows that a prolonged extreme lockdown is not always necessary.
The demography of the disease
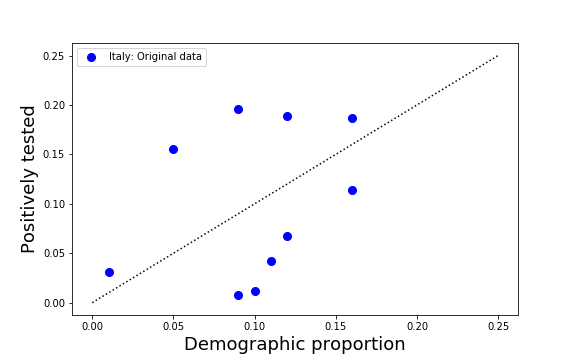
In my post on the demography in Italy I have shown that there is a unbalance between the age distribution of the positively tested and the proportion of the various ages in the country.
I have finally found some data that concern Berlin. Thanks to its good healthcare capacity and to the fact that the lockdown was imposed pretty early at the beginning of the COVID-19 spread, the city has been able to test many people in short time and to a good extent to isolate most of the infected.
The data on the age distribution of the positively tested is in the webpage of the LaGeSo whereas the data concerning the age distribution in Berlin is contained in a document of the Amt für Statistik Berlin-Brandenburg, in a document that can be found only with Google. Apart from the arbitrary (and different) partition of the age classes in the two documents, one can find something very interesting.
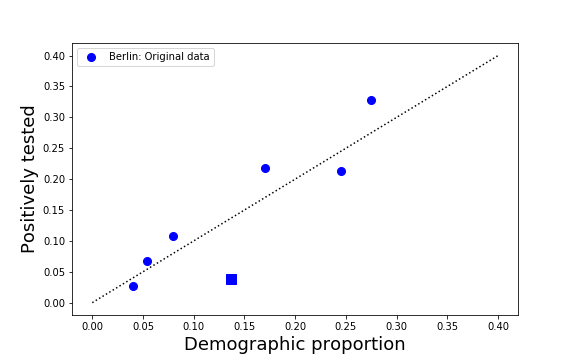
In Berlin, the youngest age class (people aged below 15) have been found positive much less than they are represented in the population. Is this the result of poor testing in this age class or because this age class is so resistant against the virus that the tests are really negative? The age distribution of all tested people would answer this question but this distribution is not available.
I assume here that the shift off-diagonal of the data concerning the youngest age class is due to poor testing in this class. So the question is now: how many people in this age class would have been found positive if tested?
A simple calculation can correct this statistics and show the result.
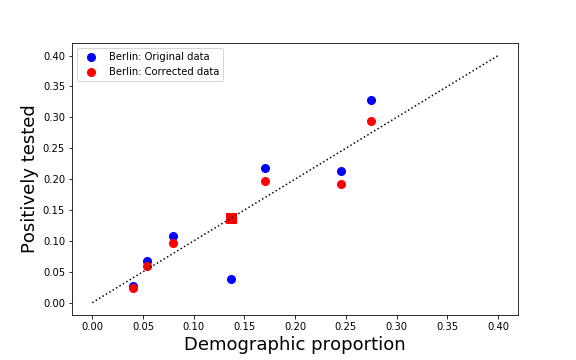
There is a surprising result. We need 588 additional infected in the youngest age class to make the plot look like more correct. The method that I have employed here is very brute (see below) but it shows that some data in this age class is missing.
How many of these more than 500 young people are still infected and infectious? Is an early school start a dangerous move?
This analysis and the comparison with Italy shows that when testing is done at high rate, the proportions of positively tested across age classes is close to the proportion of the age class in the population. This justifies a posteriori the assumption that I was making in my previous post on Italy. An exception may be represented by the older people if they have been protected against the contact with the rest of the population or some systematic behavior.
As a note. Using the data of the LaGeSo on the statistics and assuming that the number of positively tested is very similar to the number of infected, I come to an infection fatality rate in Berlin of less than or around 3%. This infection fatality rate is much larger than other estimates in my previous posts. It may indicate that the total number of infected in Berlin is ten times larger than the number of positively tested.
Detailed calculations
The data collected from the above sources are summarized in the following table
| Age class | Percent of positives | Demographic percentage |
|---|---|---|
| 0-14 | 3.9% | 13.6% |
| 15-19 | 2.6% | 4.0% |
| 20-24 | 6.7% | 5.4% |
| 25-29 | 10.8% | 7.9% |
| 30-39 | 21.9% | 17.0% |
| 40-59 | 32.8% | 27.4% |
| 60- | 21.3% | 25.6% |
As we see from the table, the first age class is underrepresented in the percentages of the positively tested. This means that this age class has been poorly tested.
To find the corrected value y1 of positively tested in this age class we proceed as follows. Let x1 be the current number of positively tested in this age class. Let x2 be the current total number of positively tested in all other age classes. Then, x2 remains unchanged while x1 changes into y1 in order to achieve the proportion p1 = y1/(y1+x2) for p1 = 0.136. Solving this equation gives y1 = x2 * p1/(1-p1). By using p1 = 0.136 gives y1 = 792, which is 588 more than what is given in the official statistics of the LaGeSo as of today.
Maybe this was interesting. Maybe not.
Stay healthy and take care.