In Vo’ (Italy) and in Berlin people younger than 10 years are underrepresented in the statistics of positively tested. The study in Vo’ indicates that this may be a true biological effect.
A preprint on medRxiv [1] (not yet peer reviewed) from the group of Ilaria Dorigatti (Imperial College London) and Andrea Crisanti (Imperial College London and University of Padova) provides a unique set of numbers and statistics about the small center Vo’ (Italy) close to the town of Padova. I compare this data with those from Berlin that I have shown in one of my previous posts.
The youngest don’t get it?
On the entire survey made in the study about Vo’, no young person below 10 was infected in two trials in which almost the entire population was tested for the presence of SARS-CoV-2 with nasopharyngeal swabs.
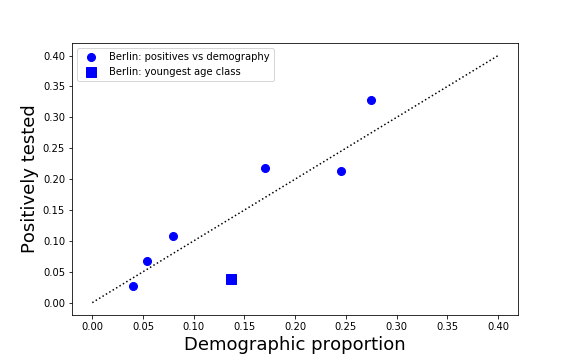
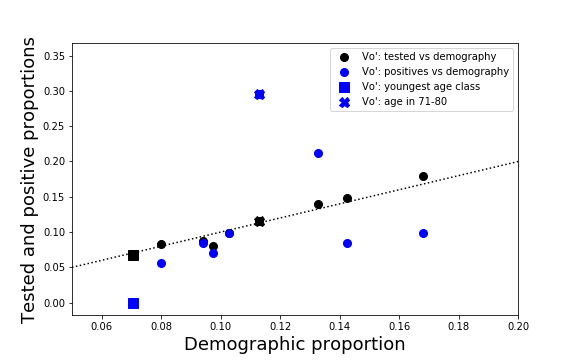
A striking feature of both data sets is that the individuals at age below 10 are typically underrepresented in the statistics of the positively tested. Similar data is visible in the Italian case statistics as well. In my previous post about Berlin I have argued that this effect is due to poor sampling in this age class. My conclusion was based on the idea that the virus does not distinguish between ages when infecting and that only the symptoms would depend on the age so that symptomatic would get tested more often
The comparison with the dataset from Vo’ and Berlin rises a different hypothesis, originally formulated in [1]. The question is if the data indicate that there is a mechanism that prevents the virus to stay sufficiently long in the throat of the youngest to be detected. In fact, both the data from Italy (entire country) and the data from Berlin show that it is not impossible that the youngest get a detectable amount of virus but that it is very unlikely. The data from Vo’ would support this hypothesis.
Are the children naturally immune? Or do they acquire a stronger immunity by means of other vaccinations? An immunological study will tell us eventually.
No country for old people?
The data from Vo’ contain another striking feature that may have to be considered or discussed by the authors of the paper. The percent of positively tested in the age class 71-80 is much larger than expected from the demographic distribution.
The data from Berlin do not show such an effect. My hypothesis is that in the study concerning Vo’ the age distribution of the tested individuals fits the demographic age distribution (black symbols), but sampling in this age class (71-80) may be not random. One possibility for this deviation is that a significant amount of the tested individuals in this class lived together in the same senior citizens home.
Data and details
The data for Berlin are summarized in the following table
| Age-class (demography) | Number (demography) | Age-class (positives) | Number (positives) |
|---|---|---|---|
| 0-5 | 224611 | 0-4 | 65 |
| 6-14 | 286606 | 5-9 | 52 |
| 15-17 | 85672 | 10-14 | 86 |
| 18-19 | 63307 | 15-19 | 137 |
| 20-24 | 203114 | 20-24 | 348 |
| 25-29 | 297698 | 25-29 | 565 |
| 30-34 | 338740 | 30-39 | 1142 |
| 35-39 | 299825 | 40-49 | 825 |
| 40-44 | 244238 | 50-59 | 887 |
| 45-59 | 783917 | 60-69 | 434 |
| 60-64 | 205035 | 70-79 | 332 |
| 65+ | 715385 | 80+ | 349 |
The data for Vo’ are summarized in the following table:
| Age-class (demography) | Number (demography) | Number (tested) | Number (positives) |
|---|---|---|---|
| 0-10 | 231 | 190 | 0 |
| 11-20 | 262 | 235 | 4 |
| 21-30 | 308 | 247 | 6 |
| 31-40 | 336 | 279 | 7 |
| 41-50 | 466 | 415 | 6 |
| 51-60 | 550 | 504 | 17 |
| 61-70 | 434 | 391 | 15 |
| 71-80 | 369 | 325 | 21 |
| 80+ | 319 | 226 | 5 |
References
[1] Lavezzo et al, “Suppression of COVID-19 outbreak in the municipality of Vo’, Italy”, medRxiv 2020
[2] LaGeSo
[3] Amt für Statistik Berlin-Brandenburg
Maybe this was interesting. Maybe not.
Stay healthy and take care.