In Gangelt (Germany) it is 0.37%. Among workers of the Italian healthcare system it is 0.3%. The WHO suggests an overall mortality of almost 2%. Who’s right?
To get an overview of what the problem is, which countries are testing and how much, what are the various definitions of death rates I suggest the article on https://ourworldindata.org/coronavirus#testing-for-covid-19
Health workers in Italy
The official data of the ISS are reported below:
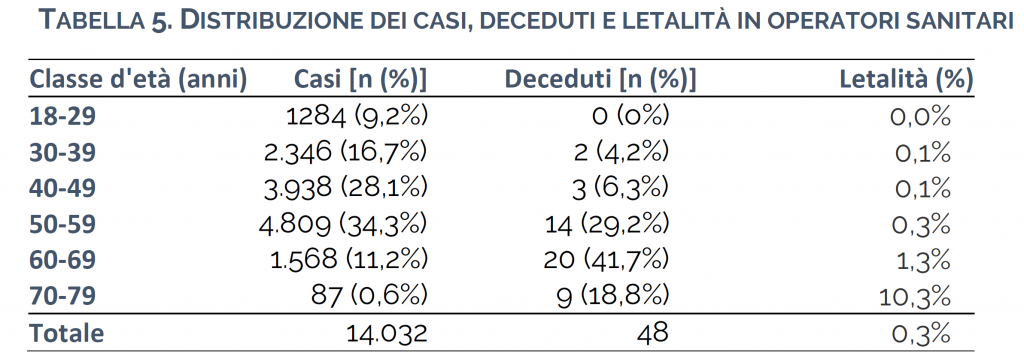
The special issue about this table is that the total number of positive cases among healthcare workers represents one tenth of the total number of positively tested people in Italy. Note that, including all doctors and all workers in the national healthcare system (including veterinary doctors, the private sector etc) I come to a 2 million workers in total. This is one every 30 people in the country.
Thus, the workers in the Italian national healthcare system have been tested at a much higher rate than the general population. We can assume, as a rough approximation, that all those who were positive until April 9 (date of the survey in the table above), were also the total number of infected. This means that the 0.3% death rate computed here is the closed approximation that we have so far for the death rate under controlled conditions. The sharp increase of the age-dependent mortality for the last age class is striking: the number of workers in this class is one order of magnitude smaller than the other ones while their death rate is one order of magnitude larger. Is the sample size too small?
This table has some drawbacks, though. The statistics proposed in this table was not made with the purpose of estimating the death rate. It lacks therefore the randomization. Furthermore, it is also possible that tests are clustered in few hospitals, thus artificially increasing the sample size. With the raw data at hand, a bootstrapping approach would allow to randomize them, reduce the sample size to the number of hospitals or work places and compute the confidence interval. But we won’t have dramatic increase of the death rate.
In summary, it seems that a death rate of 0.3% is a reasonable approximation death rate.
How many infected?
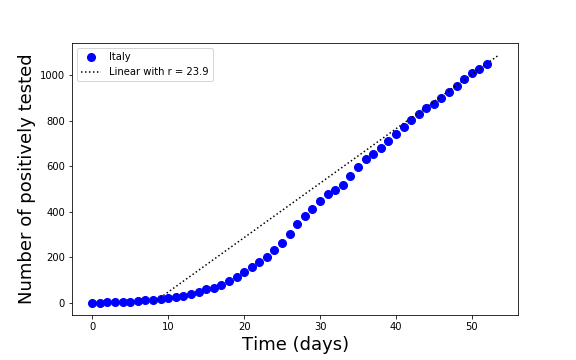
If we take the 0.3% of death rate as a good approximation, the number of infected is computed using two additional information. On April 9, the number of death was 16654, Thus, the number of infected is about 17000/0.003 which makes up to about 6 million people. The growth of the number of positively tested is now linear with a rate of 3700 new positively tested per day.
The median time from positive testing to death is 10 days. Therefore, the 6 million infected refers to those that were infected 10 days before. Furthermore, the number of new infected people increases linearly. Officially, on April 2 there were around 100000 positively tested. This is 60 times less than the number of infected. With a linear growth of the number of positively tested, we can assume that also the number of infected grows linearly. On April 9 then we had about 8 million infected in Italy. This calculation is based on many assumptions, but it shows that a such a small death rate has the potential to reveal the huge dimension of the pandemic behavior. The tests based on the detection of antibodies will eventually fix the issue.
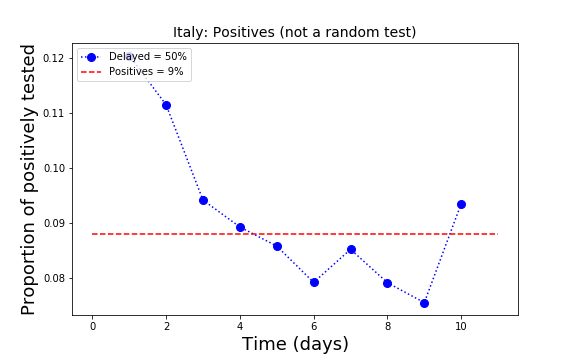
On the other side, with 9% of all tests being positive, we can extrapolate that about 6 million Italians are infected. It is interesting how the proportion of positively tested, as seen in the plot, has actually decreased with time. This plot is the only clear measure of the efficacy of the containment measures.
Gangelt (Germany)
Like for the case of workers in the health system in Italy, also in the city of Gangelt there has been a massive testing after the lockdown and the relaxation of the number of cases. The data (not published!) indicate that 15% of the entire population has been infected. Taking the total number of death, this leads to a death rate of 0.37%, much less than the 2% estimate from other sources.
The testing was done on about 500 people, probably including people from the same household by exploiting antibody reaction tests.
As with the case of Italian healthcare workers, the sample size might have to be reduced if the number of families is much less than the 500 participants. In any case, this would most likely increase the error on the estimated death rate but not on the value itself.
A drawback of these claims is however, that there is no data available as of today in order to check the validity of the calculations and details of the experimental procedure are also unknown.
Stay healthy and take care!