Four countries are mostly involved in the diffusion of the virus. Italy, Germany, France and Spain. While Germany and France seem to have reached a certain control, Italy will be probably able to gain control in few days. The situation of Spain is instead still critical.
The figures and the situation changes day-by-day but a tendency is what we can see. Again, the most difficult part is that an increase or a decrease in the numbers in one day reflect effects and decisions that occurred several days before. The numbers may also reflect some fluctuation in the delivery time of the data. The analyses proposed below are up to the present point. New data are available today but many factors seem to indicate that these data are yet to be confirmed. On a first look, though, the new numbers do not modify the analyses shown here.
Models for the analyses
The data are compared against two models: the exponential function and the polynomial of degree two. If the last data point (a black square in my plots) is below the line computed with the exponential model, this means that the growth may start to become slower than exponential. If it is also below the line computed with the polynomial of degree two, it may mean that a stabilization is taking place and in about ten days the number of new infections stabilizes. At that stage, the total number of infections should grow linearly with time, meaning that the number of new infections is balanced by the number of recoveries.
Still, it makes a big difference for the national health system, also under stable conditions, if the number of new infections is 100 or 10000.
The sooner the stabilization takes place, the smaller is this number and the easier it becomes to govern the turn-over until the infection stops. Eventually, a situation similar to what we see in South Korea and in Hubei should occur and the virus stops expanding.
Italy and Spain
As Italy got the hard start, with patient 1 opening the coronavirus season, the country has also been caught not well prepared to take immediate measures. The situation in Italy is now under a strong quarantine, which will have its effects in the next one or two weeks, assuming that both people and the government do not relax. The strong flow of people who moved across regions in the first days of the new rules may create very critical situations in the southern italian regions.

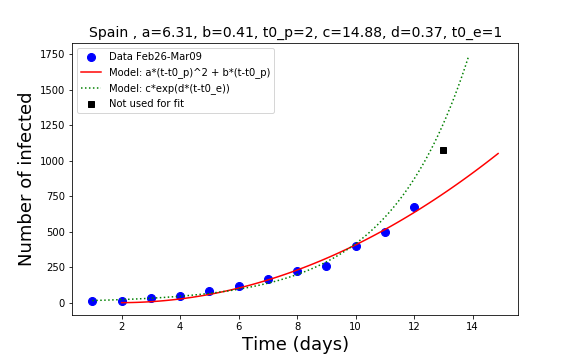
Spain seemed to have been able to control somehow the growth of the number of infected starting at day 11 of the plot, but this was too early optimism. The exponential growth is still the best of the two models. However, fluctuations in the delivery of the data may still play an important role. We will see more in the next days. At the moment, with the exponential model on the lead, the situation is alarming. Strong action is needed, much like in the same direction as Italy is doing.
For both countries, gaining control by drastically reducing social hopping is the highest priority to avoid the collapse of the national health system.
Germany and France
Both well organized and rich countries, they have had time to look at what happens in Italy and to develop an epidemic plan. Germany policy at present is getting more and more serious as the days go. There is, at least in Berlin, a moderate stress level in the population but too many people are very relaxed and still consider the virus a minor problem. Some organizations have cancelled the big meetings as well as big sport events have been cancelled for the moment. The health minister Mr Spahn has given the advice to cancel all gatherings and events where more than 1000 people may attend (where does the 1000 come from, is not clear, but see my comment at the end of this post).
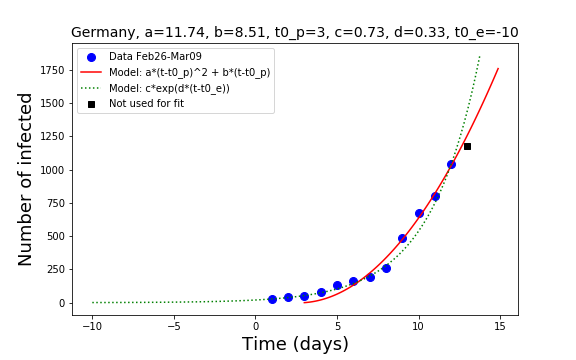
In Germany, the race between the exponential and the polynomial expansion of the number of infected is not yet decided but I see room for optimism. The new data falls below the red line, indicating a cross over to a more relaxed situation. Nevertheless, a growth like power of two of the time is still not good news.
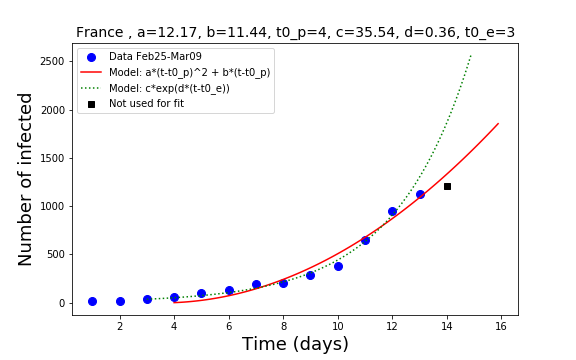
France seems to be on a safer side, despite having a similar total number of infected people as in Germany. With a limited movement from Italy, and not much social hopping in France between regions, the country might be on the right track to a steady state condition where the new infected are balanced by the recoveries. Still, weekends data may underestimate the real trend. We will have to wait until mid of the week to see how things are going.
The available data
It is not that easy to get reliable data for each country. The only universal repository source of national data (for the European countries) is the time series updated by the Johns Hopkins University which is what I use for the analyses. For Italy, the best source of data is the dedicated page of the IlSole24Ore where data from the main regions are also provided through interactive graphs. In Germany, the Robert Koch Institute is the scientific authority for the analysis of the development. Its scientists elaborate the advice for medical doctors and policy makers. It is however not clear where and if the data about the infection are made publicly available. The JHU data is also the only complete data concerning France, for which I could not find any national resource.
How many infected people are there?
Of course, we don’t know. Let us take France. The best model at present is the polynomial model. According to this model we can compute how many people will there be as total number of infected in 10 days from the last data point. Why 10 days? because I assume that people who are infected today -but still not tested- will be found within the next ten days. This makes then a total of about 5000 people.
So, based on the model there are 5000 infected people today in France. This is about 4000 people around, who are infected and nobody knows.
In a population of 70 million people, it makes (over the whole country) less than one infected person every 10000. Thus, the probability that in France one person at random is infected is 0.0001. This seems a very very small probability.
What is the probability that in a group of 1000 people at least one is infected? The calculation is 1-(1-0.0001)^1000, which makes about 10%. In summary, if 1000 people meet, there is a 10% probability that at least one of them is infected. In a group of 100, this probability is 1% that at least one is infected.
A curious universality
If we look at the exponential functions of the four countries analyzed here, we see that the rate of the exponential function is very similar across the countries, between 0.3 and 0.4 per day. I would interpret this by saying that in the exponential phase, a new hot spot or cluster arises every 3 days. In a different way, the number of people infected doubles every two days in the exponential phase.
Thanks for reading. Enjoy the day.
Interesting! Why did you opt to do the analysis on a linear, and not on a semilogarithmic scale? One would naively assume that the functional forms would manifest clearer with the latter choice, right?
Thank you Markus for the comment. I have initially tried to see if a semilog plot would help but the departures from exponential were too big and the plot was much harder to interpret. In a semilog plot variations on the y-axis are squeezed. In some cases the plot looks better but my impression is that we don’t learn more from that. The fit to the exponential is made on the log-scale but the plot is on the linear scale. AV