So far, there seems to be no evidence that high temperatures and summer will help somehow. An official of the WHO, interviewed in an article appeared in CNBC correctly says that we have to assume that summer or high temperatures will not help. If summer will instead help, then that’s good news.
The reason for this question is that several other viruses are seasonal (like for instance influenza). The influenza virus seems to have a hard time with high temperatures. Perhaps also our body has stronger innate immune resistance at high temperatures. But concerning the coronavirus, what do the data tell us?
Coronavirus in warm areas
It is in fact quite hard to find a “warm” country with a large number of infected (see the map here). With winter in Europe not giving up, there remain only a few countries where to look for trends. Although Iran has not been really warm in the last month, one could assume that it is somehow generally warmer than Europe.
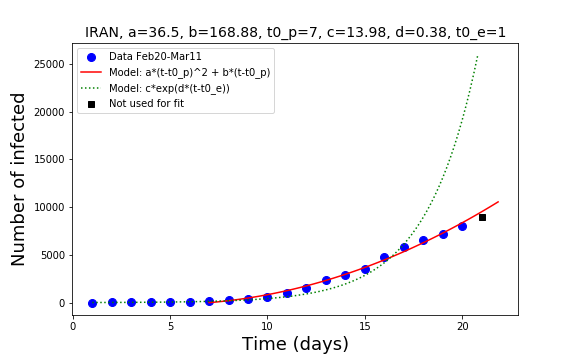
The trend in Iran is clear: the country is slowly gaining control, the exponential growth is over and the last measured point is below the red quadratic line. Hopefully, this will continue to bent and a cross-over to an even slower growth takes place. Nevertheless, temperature doesn’t seem to have helped the country staying safe. Rather, probably the large number of people coming and going from China and Europe contributed to the spread of the virus.
Hong Kong is as warm as Iran in these days. There, the policy of control and safeguard has been pretty successful.
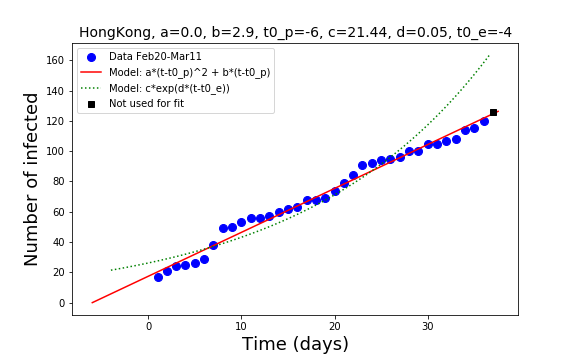
There, a linear trend indicates that hospitalization is under control and in fact 120 infected in a population of 8 millions is not a very large percent. Still the question is why the spreading of the virus it doesn’t stop. It is therefore safer to see the good trend in Hong Kong as an effect of prevention than as an effect of warm weather (if any).
A place definitively much warmer (26 degree Celsius), and with some data to show, is Malaysia
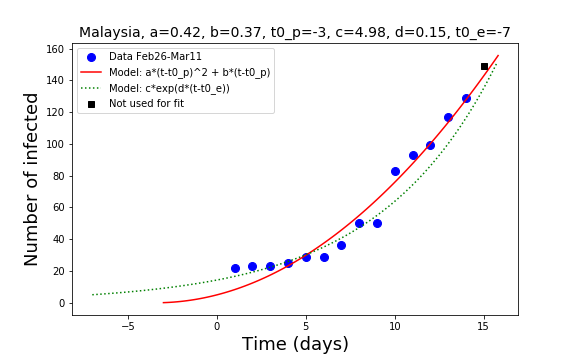
On a population of 30 million after 15 days we have only 150 infected. But the trend is very similar to the early phases in almost all other places. So, not a clear sign that temperature might help.
Spain: a counter example
In Spain the temperatures are slightly higher than in northern Europe. Madrid is quite warmer than Roma, but still we don’t see a good trend there
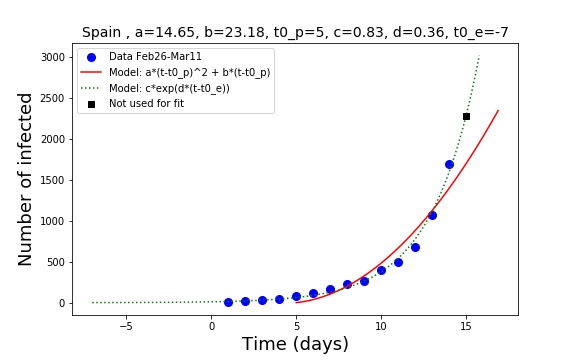
Without a stronger initiative from the government, which seems to be rather trying to save the tourism industry, this trend cannot be changed.
South Korea: a good example
According to NPR, South Korea system has been based on fast testing of everyone suspected. It is in fact the country that has performed the largest number of tests per million people. Together with the restriction measures to contain the infection, the result is that they have gained control.
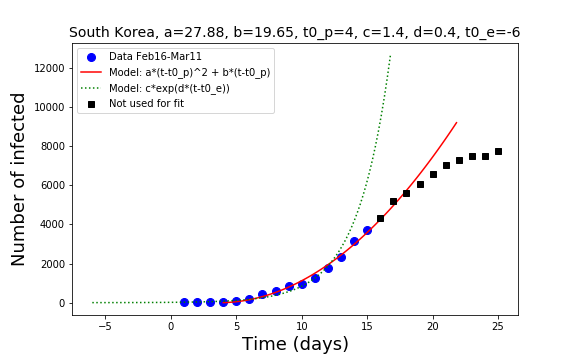
The number of infected is still increasing (about 200 new cases) but the trend has definitively slowed down. Here again, to gain control something had to be made to avoid the infection spread.
Will summer help?
Where there is data, the data does not indicate that warm temperatures help. Nevertheless, it is rare to find data in warm areas of the globe. Maybe we are still in the transient where more and more countries will get hit as hard as China, South Korea, Italy and Iran, including the warmer ones? Based on the data, this question has no clear answer so far. So better stay safe and follow the protective advice of the WHO.
Thanks for reading!