Getting a reliable estimate of the number of infected is important in order to decide what resources should be made available. There are two ways to achieve this that are explained in this post. The first of them is based on random sampling from the population. The other one is to back-propagate starting from the number of death cases.
Problems with the number of infected
How many new people are infected and how many people in total were infected is the only number that we can get so far. These numbers, one being the cumulative of the other, suffer from one problem: they depend on the number of tests performed. In one extremely simplified scenario, suppose that in a given region there are only 1000 tests performed per day. Even if the entire population is infected, it will look like as if the number of new infections increases by 1000 every day in a linear relationship to time.
Thus, machines should always work at their maximum yield, more and more machines should be put in use and there must be a monitoring of the proportion of positives.
Estimates by sampling
In most countries, the machines to perform the test do not work at their maximum capacity. In Italy, for instance, the number of tests per day varied from 2500 to more than 15000. We don’t know what the maximum capacity is. This graph shows that the number of new infections on one day correlates quite well with the number of tests performed in the previous day:
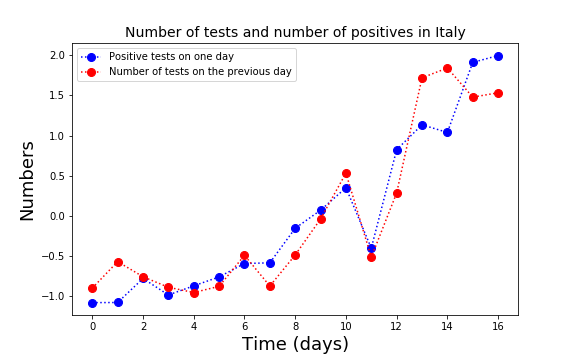
The correlation is clearly a problem because it means that the numbers that we get are an underestimate of the true figures. Nevertheless, there is a positive site. By randomly sampling in a population, we could get an estimate of the percent of people that are infected.
My proposal is that we should not only use the machines at their maximal yield but spare some tests in every region to be performed on a randomly chosen group of people. This test on random people should be performed regularly. The number of positives in the random tests should give us a reliable estimate of the percent of people actively carrying the virus (i.e. the number of people infected now, when we discard those that were infected and recovered, those that are currently hospitalized, and those that still did not get the infection).
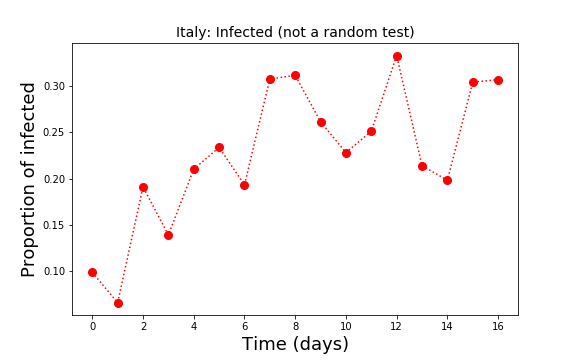
In the second plot, I show the proportion of infected among the people tested in the last 16 days in Italy. The people tested were not chosen at random. It is therefore not (yet) the test that I am proposing. Nevertheless, it shows its power as it says that for every positively tested person, in average one out of four of their contacts is also positive (I assume here that people were tested because they were in contact with a previously known case). If this plot was the result of a random test, it would indicate what is the proportion of infected people in a certain area. Taking then a mortality rate of 1% would allow to estimate the death toll of the virus in that area.
Data on random samples in every country would enormously help the authorities about how and when take action. A question to be solved is: how big should the sample be? This makes also sense only if the rate of false positives is not larger than the proportion of infected.
Estimates by number of deaths
We could first make an assumption that the death rate is not different across countries. I assume here that the death rate is 1%. We can also assume that the average time to death is 10 days (both estimates are probably incorrect. So far there is no clear way to estimate the death rate and the time to death varies wildly).
If we assume that these mortality rate and the average survival time are correct, for each one death person, there must have been (in average) 100 infected people 10 days before their death. In the case of Italy, with 2000 deaths, we must have at least 200 thousand infected, out of which only 20 thousand have been found so far. This calculation is obviously very shaky and in fact should not be taken too seriously because no one knows the death rate so far.
Even at the end of the pandemic wave, we won’t be able to easily estimate the number of infected and therefore current methods to estimate the death rate may no work.
More data and explanations
To get more data and explanations, please consult also the following links:
https://ourworldindata.org/coronavirus#
https://www.who.int/emergencies/diseases/novel-coronavirus-2019
https://healthmap.org/covid-19/
https://www.arcgis.com/apps/opsdashboard/index.html#/bda7594740fd40299423467b48e9ecf6
https://www.worldometers.info/coronavirus/
Stay healthy and follow the instruction of the health authorities concerning your behavior to avoid the contagion.
Thank you for reading and for commenting.